Remote Access Analytics: A Practical View for Technical Teams
Remote access without analytics creates a blind workflow. Connections happen. Tasks get completed. Issues get resolved. Yet no one clearly sees how efficient the process is, where time is lost, or which patterns repeat.
This gap becomes critical at scale. A small team can rely on intuition. A growing support operation cannot.
Analytics introduces structure into remote access work. It transforms raw session activity into measurable signals. Each connection becomes a data point. Over time, these points reveal how technicians interact with devices, how long tasks take, and where inefficiencies appear.
Teams that actively use operational analytics reduce average handling time by up to 40 percent . They also identify recurring issues faster, which lowers repeat sessions and reduces workload pressure.
Remote access shows what is happening now. Analytics explains why it happens and how to improve it.
What Makes Remote Data Access Valuable
Remote access analytics considers understanding relationships between multiple variables. Speaking about Getscreen.me, each session here includes a combination of technical attributes:
- timestamps define duration and concurrency;
- device metadata shows operating system and environment;
- network data reflects geographic distribution and access points;
- technician identifiers link activity to specific team members;
- optional artifacts, such as recordings, add context to complex cases.
Individually, these parameters have limited value. But when combined, they create a behavioral model of support operations.
Example
Session duration alone does not indicate inefficiency. When combined with device type and technician data, patterns start to emerge. Certain operating systems may require more time. Specific technicians may handle complex cases. Some regions may experience longer sessions due to network latency.
Why Getscreen.me Separates Analytics from Remote Access
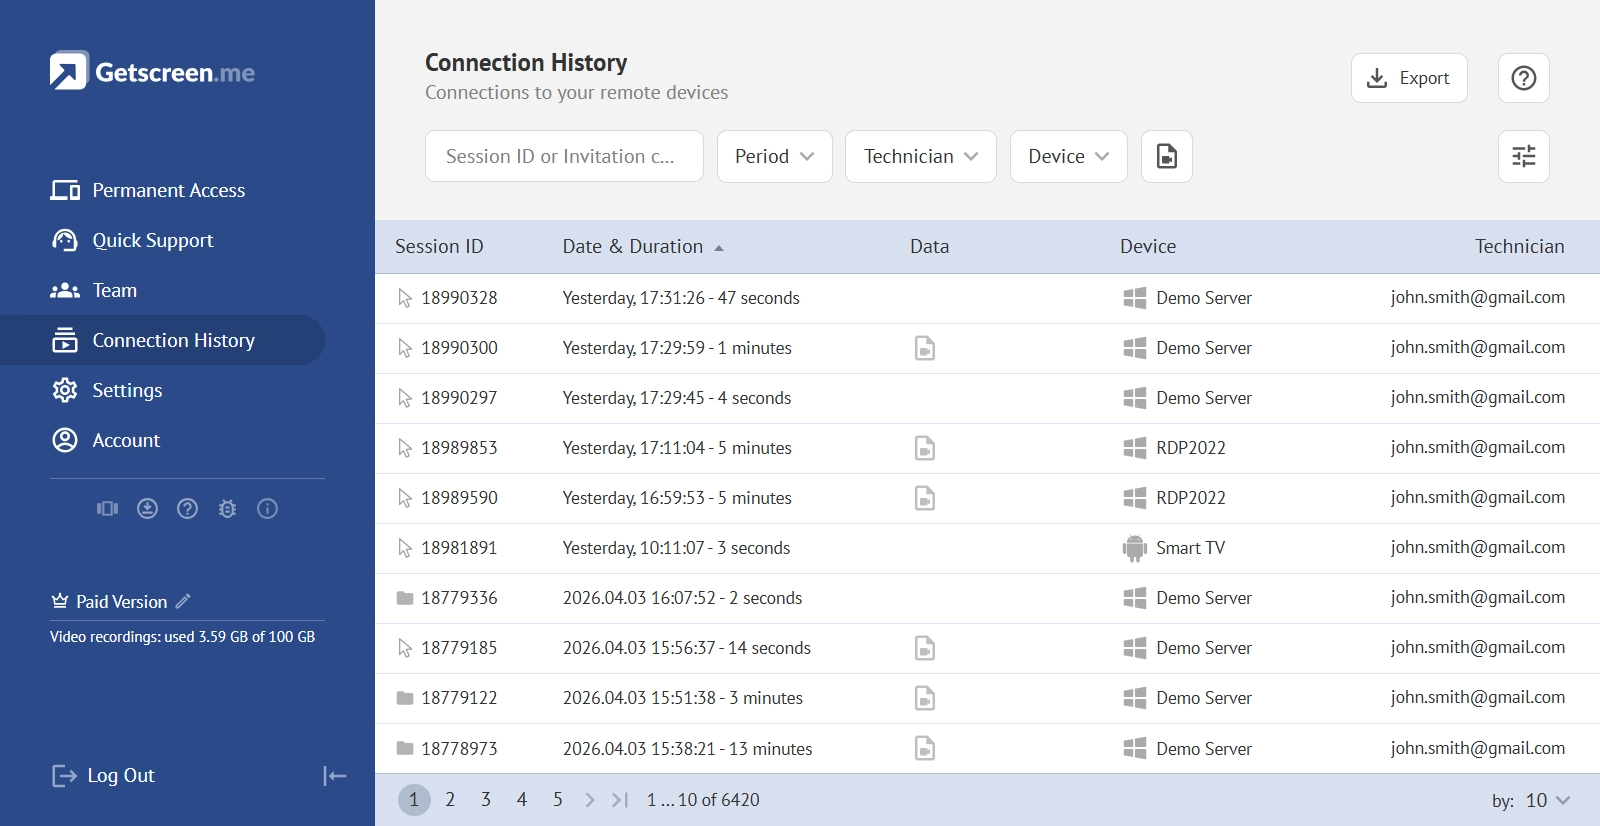
Our remote access app provides some baseline insights like connection history. It can be filtered by date, device or technicians.
However, our main mission is to ensure speed and stability. Every millisecond matters. The interface must remain clean. The connection must stay uninterrupted. Adding heavy analytical layers to this environment introduces unnecessary complexity.
Analytics operates under a different logic. It requires flexible data processing, customizable reports, and the ability to combine multiple remote data sources. These requirements evolve constantly. A fixed internal module cannot keep up with this level of variability.
Combining these two paradigms in a single interface creates trade-offs:
- Reduced performance during active sessions.
- Limited flexibility in report customization.
- Simplified data models that restrict deeper analysis.
Note
When separating analytics into an external workflow, Getscreen.me preserves connection quality while allowing teams to build advanced analytical systems without constraints.
How the Integration Model Works in Practice
Remote access analytics starts with data extraction.
Every remote session generates structured information. Start time, end time, device details, technician identity, location signals, and optional artifacts such as recordings. This data exists in the system but needs to be moved into an analytical environment.
The process follows a clear logic.
- First, the system exposes raw data through an API. This layer acts as a controlled access point where session history and related attributes can be requested programmatically.
- Second, the extracted data is placed into an intermediate storage. This step may seem technical, but it serves an important role. Analytics platforms need a stable and structured dataset. Direct real-time querying is rarely efficient or scalable. Intermediate storage creates a consistent data source that can be updated on schedule.
- Third, the data becomes available for visualization. At this stage, raw records turn into charts, timelines, comparisons, and filters. The same dataset can support multiple perspectives without changing the underlying structure.
From Session Data to Insight
Remote access analytics in Getscreen.me follows a three-layer architecture. Each layer solves a specific technical problem.
1. Data Extraction via API
Getscreen.me exposes session data through an HTTP API. This interface provides structured access to connection history and related attributes.
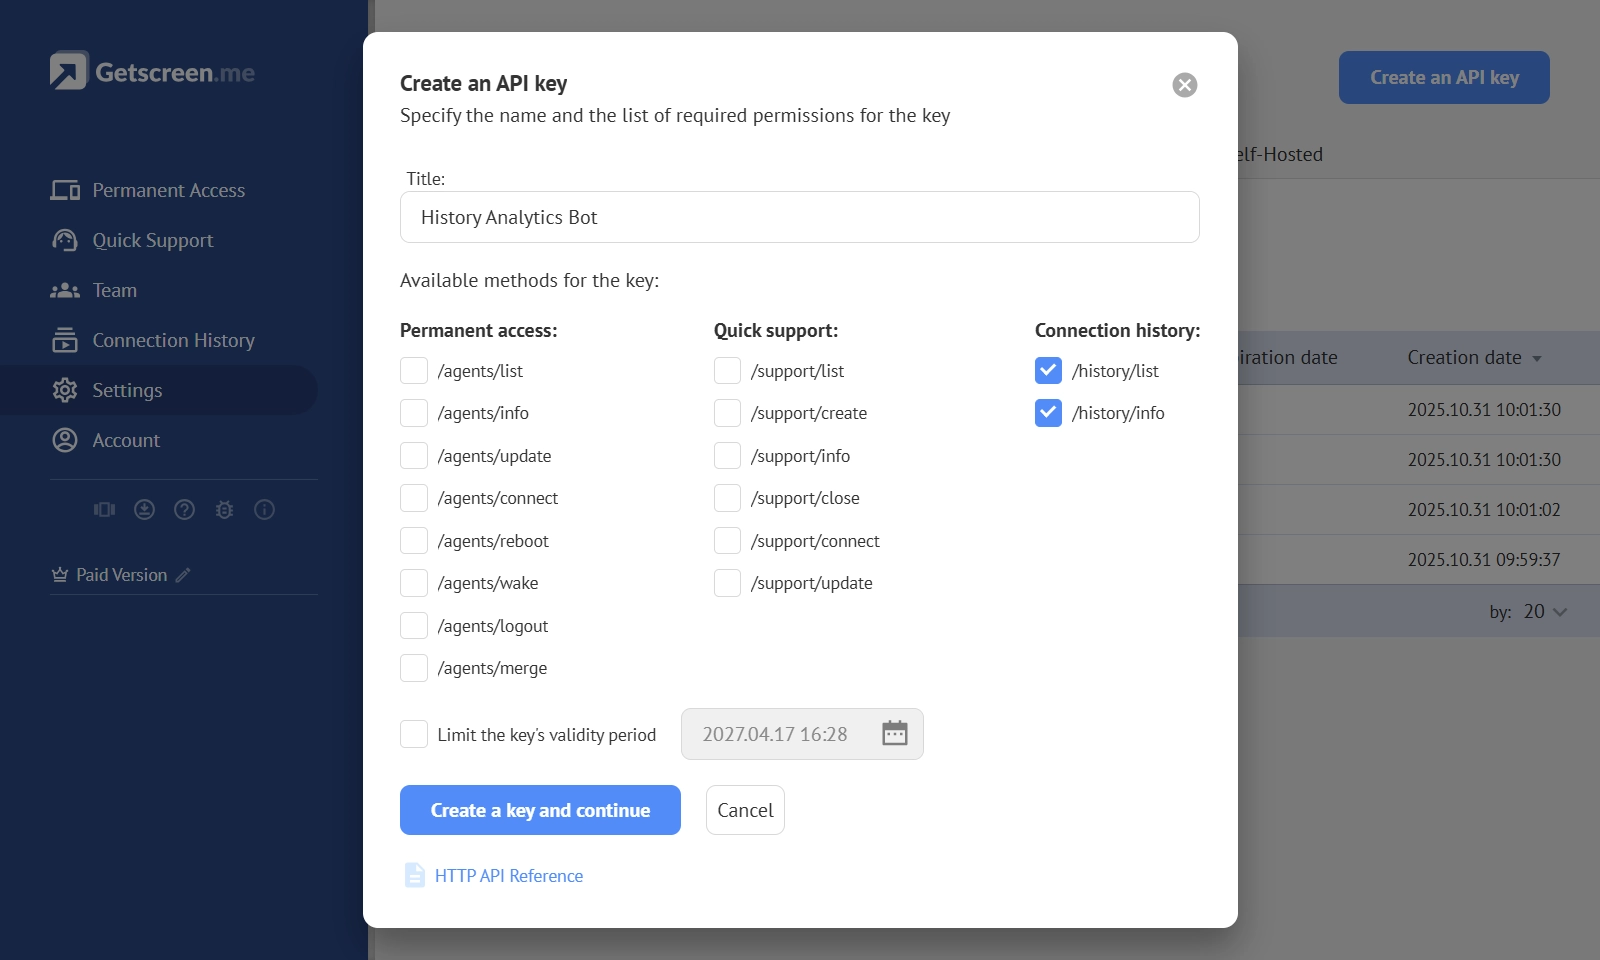
The API supports filtering by time range, device, or session type. This allows teams to control data volume and focus on relevant subsets.
The dataset includes:
- Unique session identifiers.
- Start and stop timestamps.
- Technician and device metadata.
- Client connection details.
- Geographic information derived from IP.
- Recording metadata when available.
Note
From a technical standpoint, this layer acts as a controlled gateway. It ensures that analytics systems receive consistent and normalized data without direct access to the core infrastructure.
2. Intermediate Storage as a Data Layer
APIs are optimized for retrieval, not continuous analytical queries. Intermediate storage solves this limitation.
Using Google Sheets as a lightweight data layer allows teams to:
- Store historical session data.
- Normalize fields for reporting.
- Avoid repeated API requests.
- Enable scheduled updates.
This layer acts as a buffer between operational data and analytical tools. It also reduces load on the API and prevents rate-limiting issues.
From a data engineering perspective, this is a simplified version of a data warehouse. It does not require complex infrastructure but still provides persistence and structure.
Note
Automation plays a critical role here. Scripts handle data extraction and updates. For example, daily synchronization ensures that reports always reflect recent activity without manual intervention.
3. Visualization and Analytical Processing
Once the data is structured, it becomes usable for analysis.
Platforms like Looker Studio and Microsoft Power BI connect to the intermediate storage and transform raw records into visual models.
At this stage, several technical concepts become crucial:
- Aggregation functions calculate totals, averages, and distributions.
- Time-series analysis reveals trends and anomalies.
- Dimensional modeling enables filtering by technician, device, or region.
- Calculated fields derive new metrics such as average session duration or workload per technician.
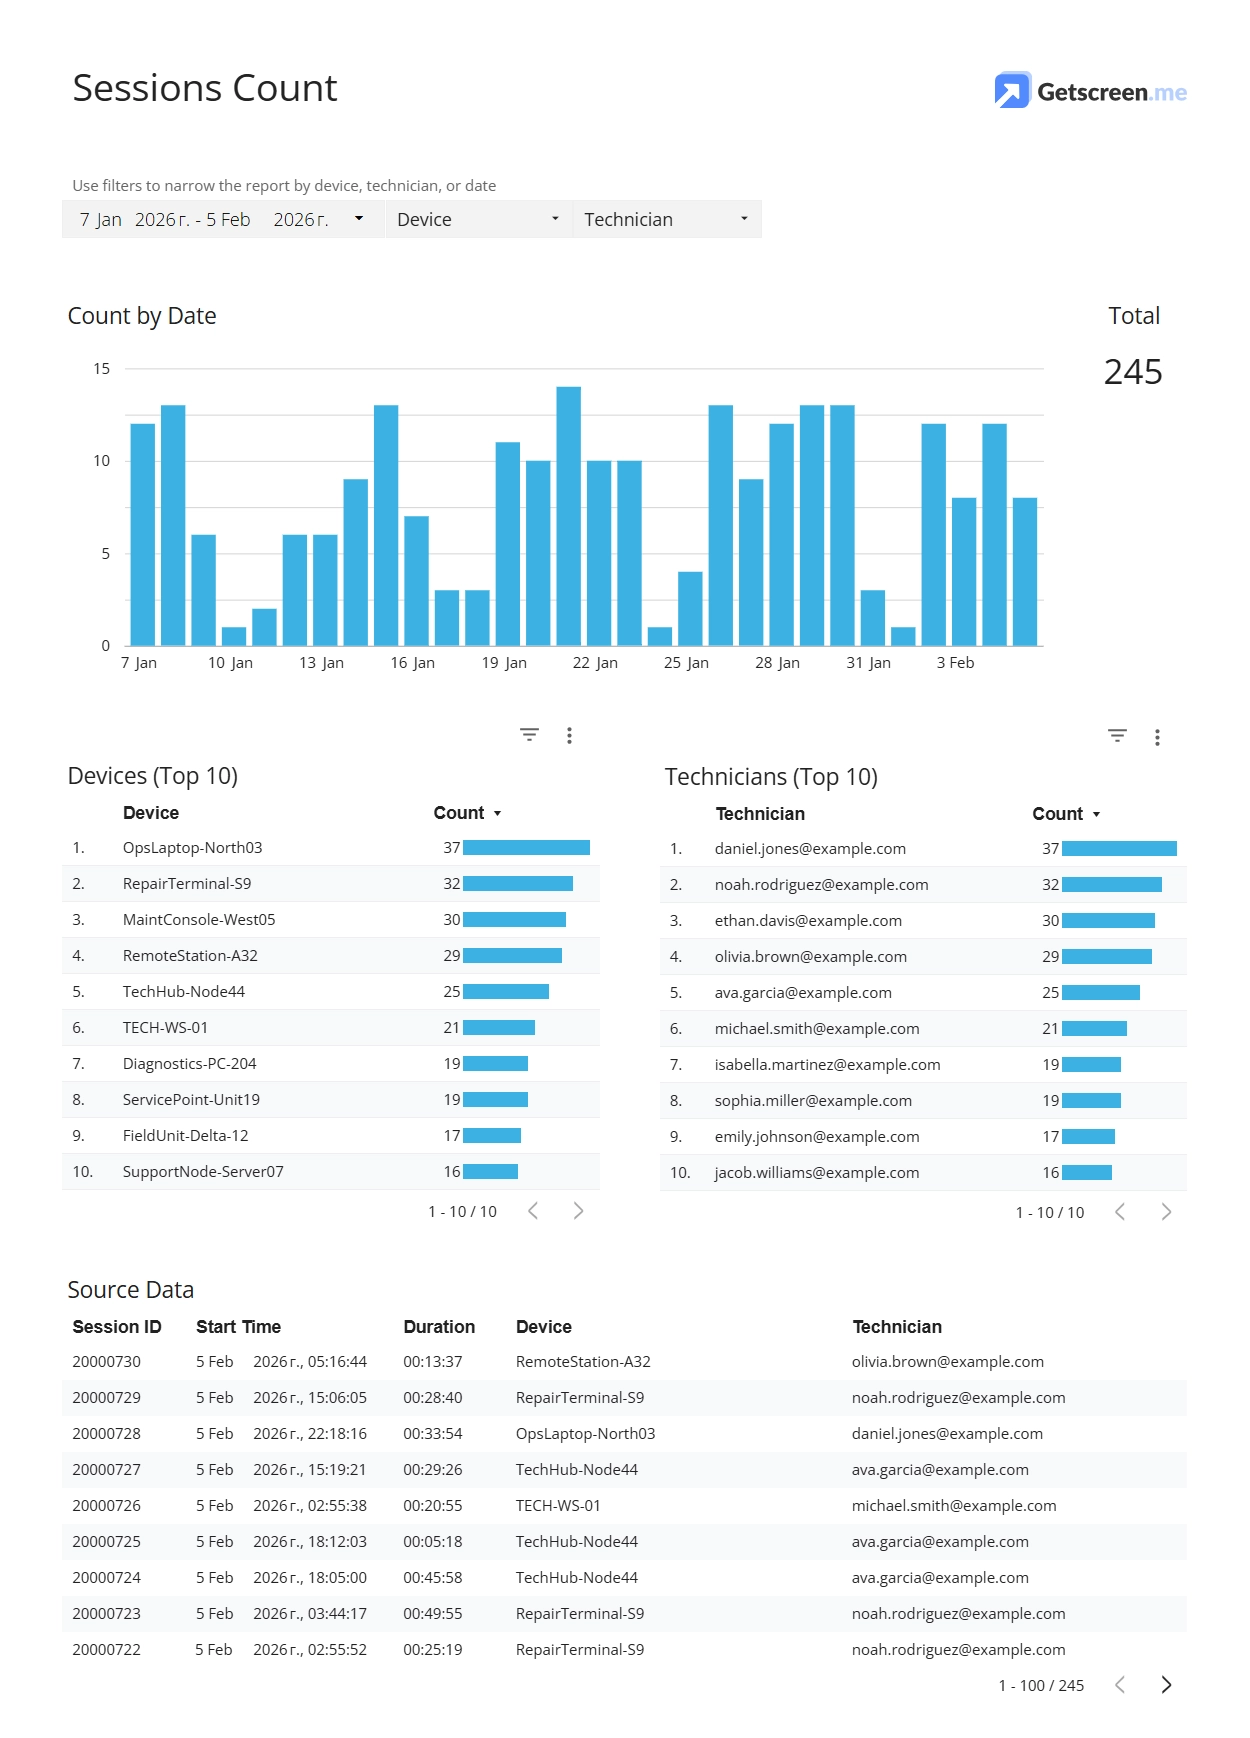
Visualization transforms structured data into operational insight. A well-designed dashboard highlights patterns. For remote access teams, several perspectives consistently provide value:
- Session timelines reveal workload distribution and peak activity periods. Device-based views show which systems require the most attention. Technician-focused metrics highlight differences in performance and workload balance.
- Filtering plays a central role. The ability to isolate a specific time period, technician, or device group allows teams to move from general observations to precise analysis.
- Raw data remains important as well. Aggregated charts provide direction, but detailed tables allow deeper investigation. When an anomaly appears, teams need to trace it back to individual sessions.
Note
The same dataset can support multiple analytical views without duplication. This flexibility is the main advantage of external analytics systems.
Final Thought: How Remote Access Analytics Changes Daily Operations
The value of remote access analytics becomes visible in small but consistent improvements.
Technicians begin to understand how long tasks actually take, not how long they feel. Managers see workload distribution without relying on assumptions. Repeated issues become visible through frequency patterns rather than anecdotal reports.
Over time, this leads to measurable outcomes:
- Reduced session duration through process optimization.
- Better allocation of technicians across devices and tasks.
- Faster identification of recurring technical issues.
- Clear performance benchmarks across the team.
Analytics does not replace expertise. It amplifies it. Decisions become grounded in data instead of vague estimation.